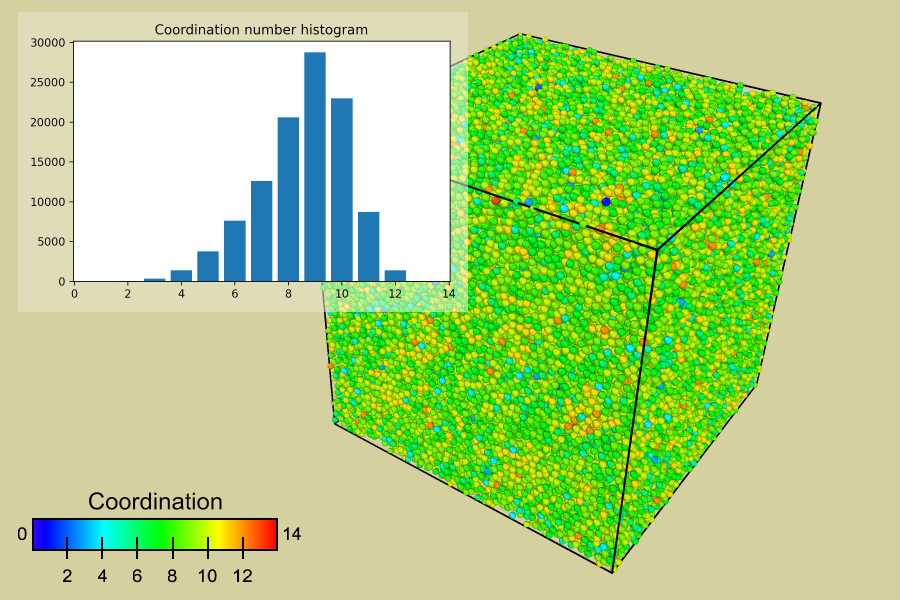
Example O2: Add a data plot to rendered images
Tip
An extended version of the Python-based viewport overlay described on this page is available as a ready-to-use installable extension for OVITO Pro. You can find its source code online at https://github.com/ovito-org/DataTablePlotOverlay.
This user-defined viewport overlay demonstrates to use of the Matplotlib Python package
to render a plot of a distribution function, dynamically computed by OVITO’s CoordinationAnalysisModifier and HistogramModifier,
on top of the three-dimensional visualization.

from ovito.vis import ViewportOverlayInterface
from ovito.data import DataCollection

class CoordinationPlotOverlay(ViewportOverlayInterface):
    def render(self, canvas: ViewportOverlayInterface.Canvas, data: DataCollection, **kwargs):
        with canvas.mpl_figure(pos=(0.02,0.98), size=(0.5,0.5), anchor="north west", alpha=0.5, tight_layout=True) as fig:
            ax = fig.subplots()
            ax.set_title('Coordination number histogram')
            plot_data = data.tables['histogram[Coordination]'].xy()
            ax.bar(plot_data[:,0], plot_data[:,1], width=0.8)
This implementation makes use of the mpl_figure() function,
which makes drawing a Matplotlib figure easy.
Note
It may be necessary to first install the matplotlib module in the embedded Python interpreter of OVITO Pro. See Installing third-party Python modules.
The overlay implementation defined above can be used out of the box with the Python script viewport layer feature available in OVITO Pro. If you want to use it in a standalone Python program to render an image programatically, you can do the following:
from ovito.vis import PythonViewportOverlay, Viewport, TachyonRenderer
from ovito.io import import_file
from ovito.modifiers import CoordinationAnalysisModifier, HistogramModifier

# Pipeline setup:
pipeline = import_file("input/simulation.dump")
pipeline.add_to_scene()
pipeline.modifiers.append(CoordinationAnalysisModifier(cutoff=3.0))
pipeline.modifiers.append(HistogramModifier(property='Coordination', bin_count=13, fix_xrange=True, xrange_start=0.5, xrange_end=13.5))

# Viewport setup and rendering:
viewport = Viewport(type = Viewport.Type.Perspective)
viewport.overlays.append(PythonViewportOverlay(delegate=CoordinationPlotOverlay()))
viewport.zoom_all(size=(900, 600))
viewport.render_image(filename='output/coordination_plot.png', size=(900, 600), renderer=TachyonRenderer())
See also