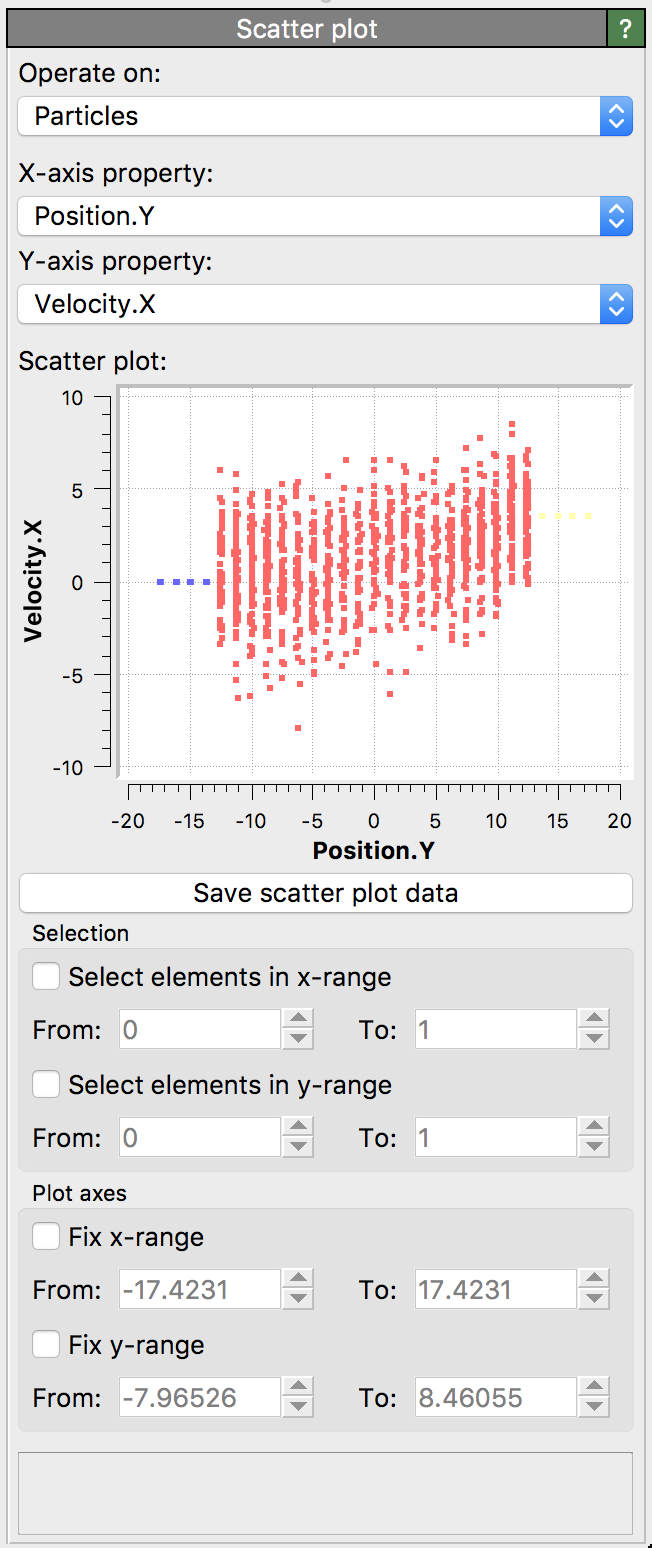
Scatter plot

This modifier generates a scatter plot on the basis of two input properties. This type of plot can be used to study potential correlations between the values of two properties. A scatter plot consists of one data point per input element (e.g. particle, bond, etc.). The first property determines the X-coordinates and the second property the Y-coordinates of the points.
In addition, the modifier can be used to select all data elements that fall within a certain range along the X or Y axis.
Parameters
- Operate on
Selects the class of data elements the modifier should operate on (e.g. particles, bonds, etc). The drop-down list will only let you select classes that are present in the modifier’s pipeline input.
- X-axis property
The property that should serve as data source for the x-coordinates of data points.
- Y-axis property
The property that should serve as data source for the y-coordinates of data points.
Acknowledgment
The code for this modifier was contributed to OVITO by Lars Pastewka.