Adding a data plot to a viewport pro
https://github.com/ovito-org/DataTablePlotOverlay
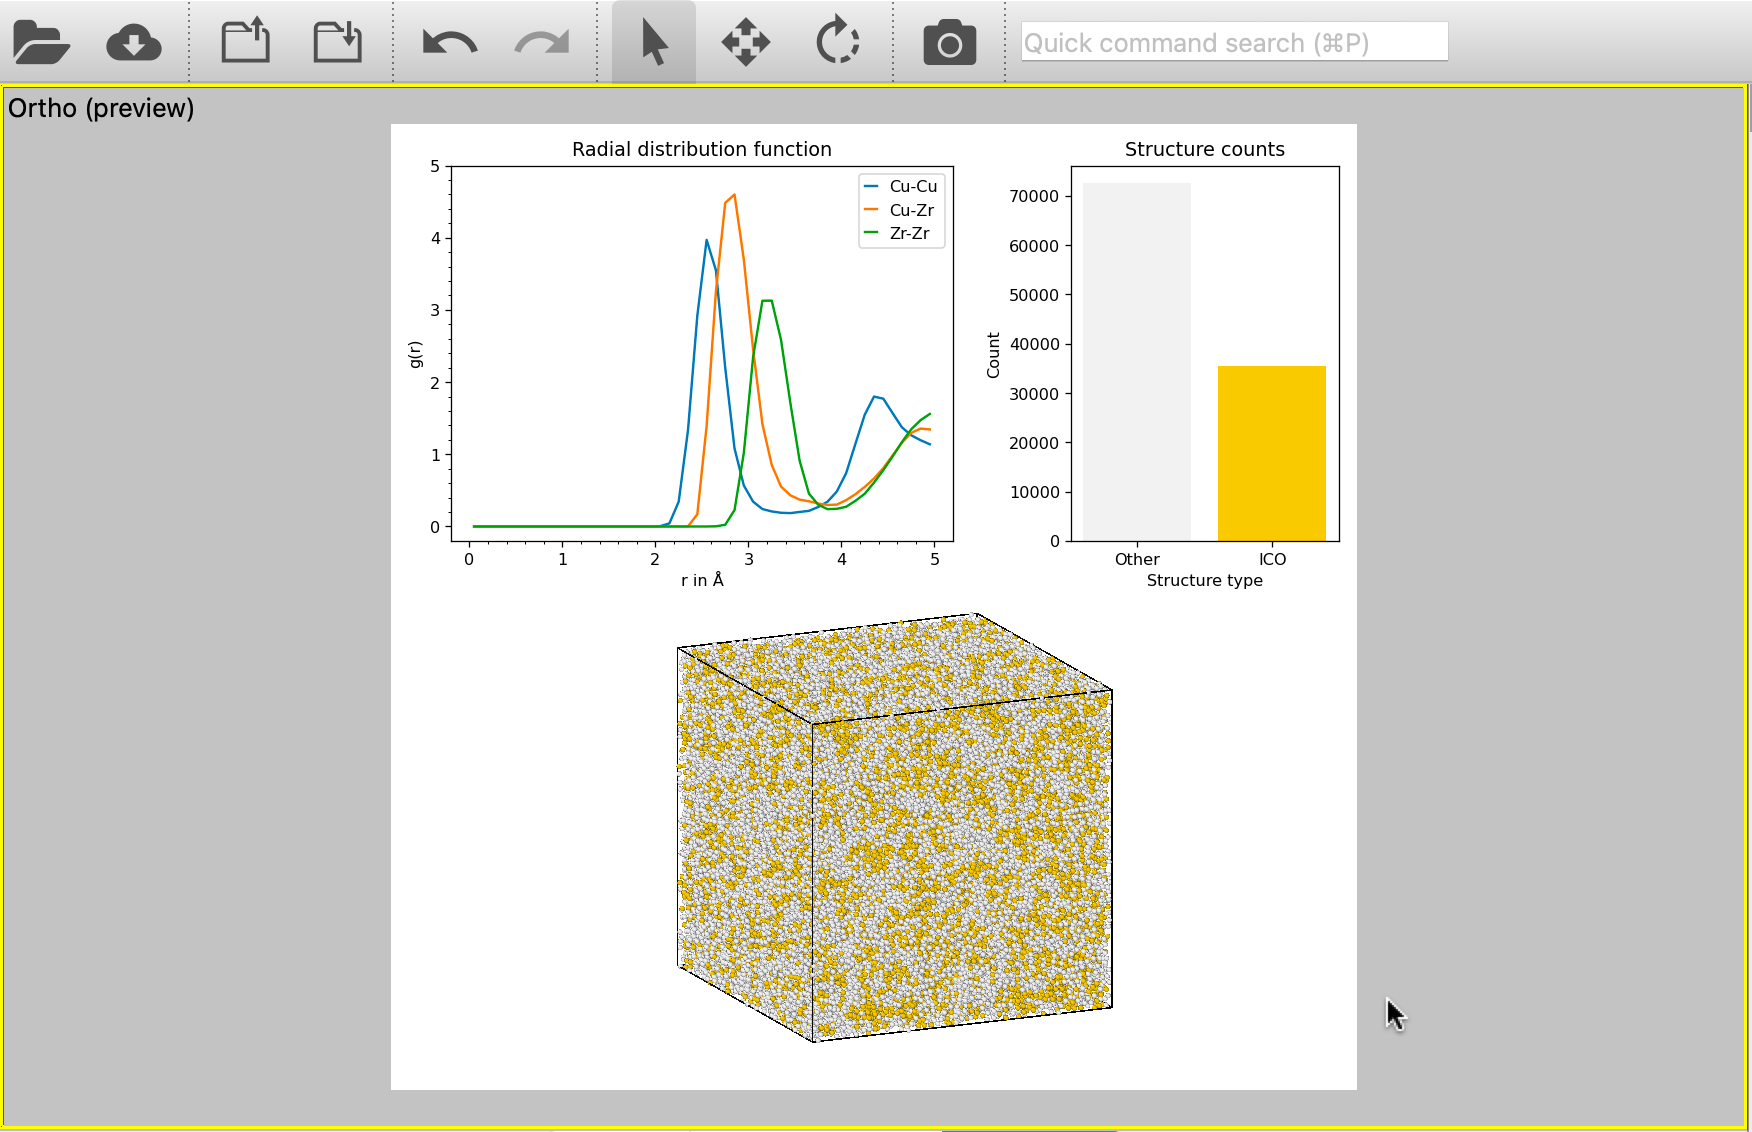
A contributed Python extension is available for OVITO Pro, which allows adding a data plot to a viewport. The plot is displayed as an overlay on top of the rendered image and can be used incorporate additional, dynamically computed information by OVITO in a visualization.
See also