Voxel grids
The voxel grid data object in OVITO is a structured grid of voxel cells. Voxel grids are typically discretized representations of spatial fields in two or three dimensions.
Either the cells or the vertices of a voxel grid are associated with numeric properties (field values). These properties may represent a variety of physical quantities, such as charge density, temperature, or magnetic field direction. OVITO supports scalar, vector, and tensor field properties on voxel grids. You can perform cell- or vertex-wise computations on these field properties with the Compute property modifier of OVITO.
Importing or creating voxel grids in OVITO
Voxel grids can be loaded into OVITO from simulation data files, for example charge density fields written by DFT simulation codes. See the list of supported input formats of OVITO to find out which formats can store volumetric data.
Alternatively, voxel grids can be dynamically generated by OVITO from other forms of data. The Spatial binning modifier, for example, projects the particles onto a structured grid to produce a coarse-grained field representation of some particle property.
Two- and three-dimensional grids
A voxel grid is associated with a simulation cell, i.e., a domain defining the spatial extent of the grid in 3d space. OVITO supports two- and three-dimensional grids, with and without periodic boundary conditions:

A two-dimensional voxel grid made of \(n_x \times n_y\) cells. Note that the two edge vectors spanning the grid’s domain are always embedded in three-dimensional space.

A three-dimensional voxel grid made of \(n_x \times n_y \times n_z\) cells. The three edge vectors spanning the grid’s domain can be arbitrary, non-collinear directions in 3d space.
Cell-based and point-based data
In OVITO, voxel grids can be either cell-based or point-based. In a cell-based grid, the interior of each voxel cell is associated with a local field value. In a point-based grid, each grid intersection point is associated with a local field value:
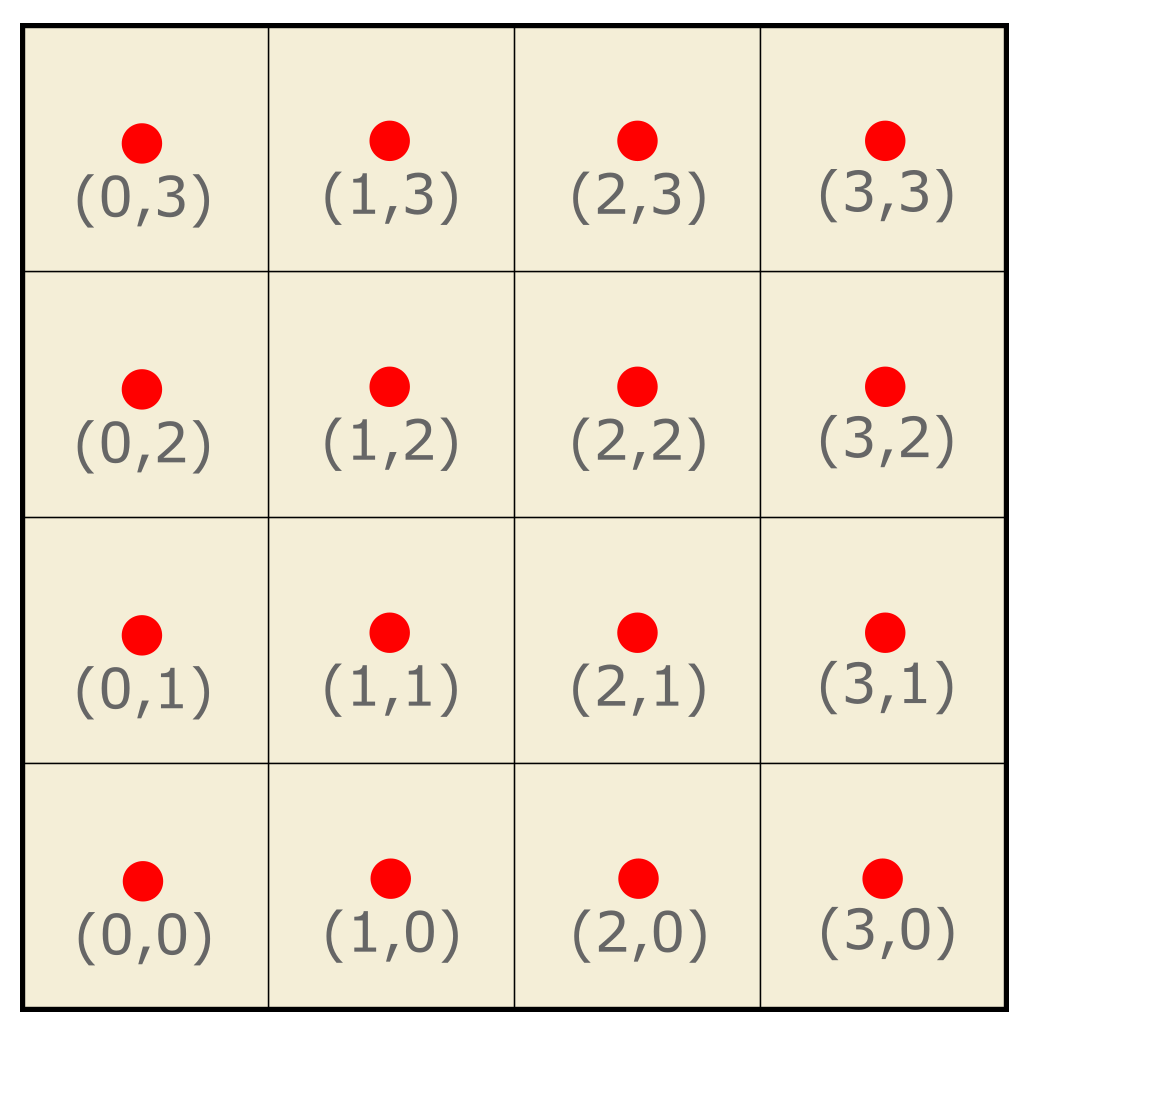
Cell-based grid
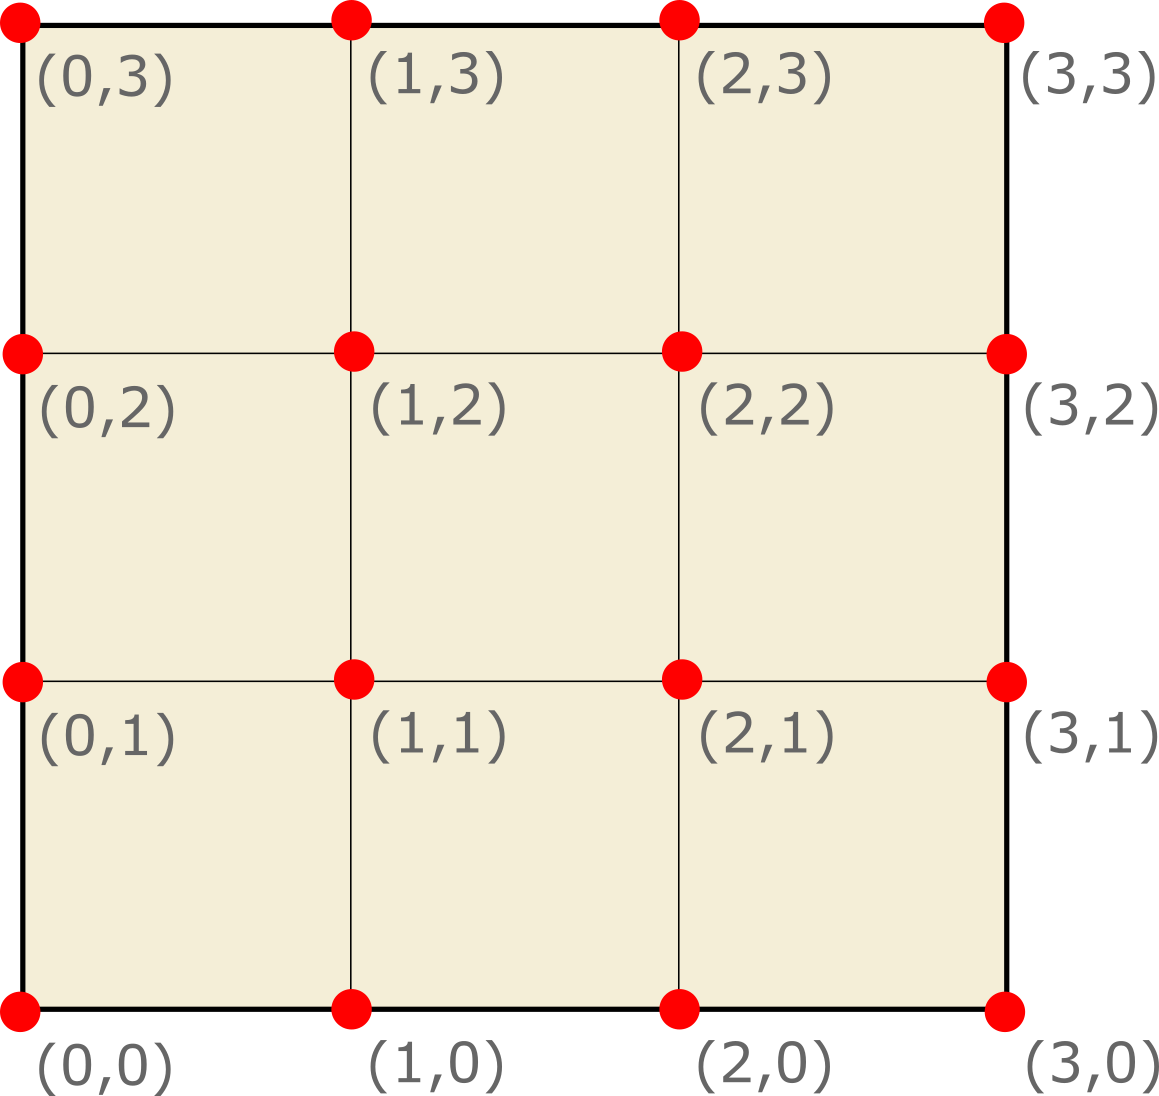
Point-based grid
In a point-based grid, the number of field values along each dimension is one more than the number of voxel cells - with the exception of directions with periodic boundary conditions (PBCs), where the number of physical data points is equal to the number of cells along that dimension. OVITO automatically supplements the grid with “ghost” data points, i.e., virtual copies of the field values at the edges of the grid, to enforce periodicity in the PBC direction.
Visualization methods
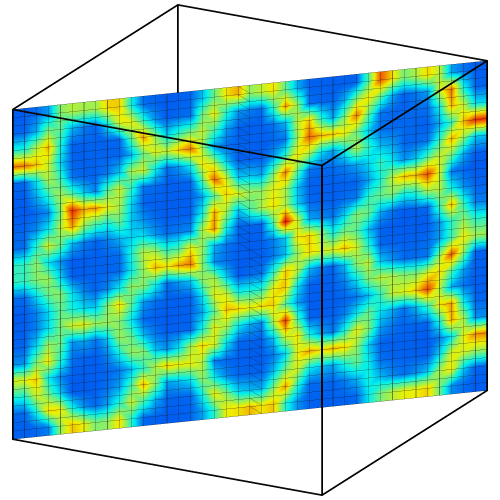
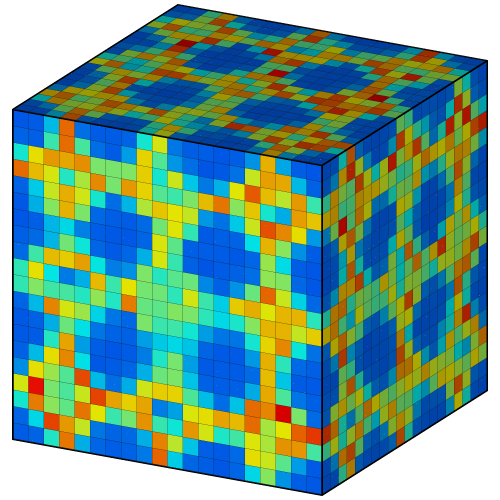
OVITO offers different ways of visualizing voxel grids. The Voxel grid visual element is the default representation automatically generated by the data pipeline to render just the outer cells of the grid (see first picture above). Thus, this visualization style makes only the field values on the surface of the domain visible.
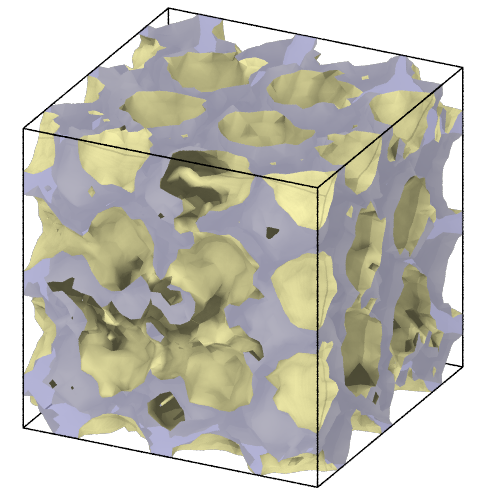
You can apply the Create isosurface modifier to compute an isosurface of the volumetric field, which is a way of visualizing the distribution of a scalar field quantity (see first picture on the right). Another way of showing the interior values of a three-dimensional voxel grid is provided by the Slice modifier. It lets you extract a planar cross-section along an arbitrary direction (see second picture on the right).
Exporting grid data
Writing the numeric data of a voxel grid to an output file is possible using OVITO’s file export function. Among the list of supported output formats the VTK Voxel Grid format can be used to produce a data file compatible with the visualization software ParaView.
See also
ovito.data.VoxelGrid (Python API)