User-defined viewport layers
OVITO Pro Python scripts
Viewport layers draw two-dimensional content on top of the rendered three-dimensional scene, e.g. a color legend or a text label. In addition to OVITO’s built-in layer types, you can implement your own in Python to add annotations, data plots, scale bars, or any other graphics to rendered images and the interactive viewports of OVITO Pro.
A viewport layer is a Python class derived from ViewportOverlayInterface, which implements the
render() method. The following layer displays the current frame number and the number of particles:
from ovito.data import DataCollection
from ovito.vis import ViewportOverlayInterface
from ovito.traits import Color
from traits.api import Range

class ParticleCountOverlay(ViewportOverlayInterface):

    font_size = Range(low=0.01, high=0.5, value=0.07, label="Font size")
    text_color = Color((0.0, 0.3, 0.6), label="Text color")

    def render(self, canvas: ViewportOverlayInterface.Canvas, *, data: DataCollection, frame: int, **kwargs):
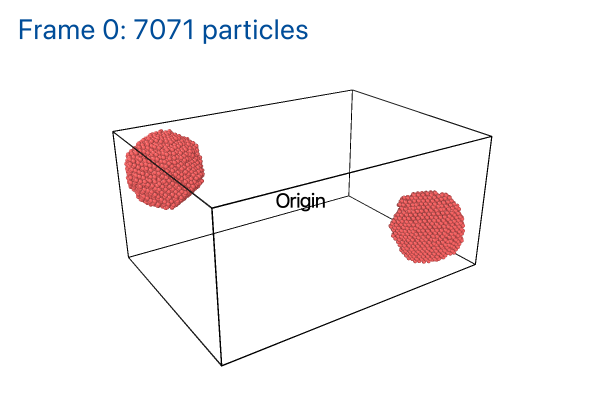
        text = f"Frame {frame}: {data.particles.count} particles"
        canvas.draw_text(text, pos=(0.03, 0.97), anchor="north west",
                         font_size=self.font_size, color=self.text_color)
The system calls render() every time the viewport gets rendered. It passes the following arguments:
- canvas:
A
Canvasobject providing drawing functions (see below).- data:
The
DataCollectionproduced by the pipeline associated with the layer, from which the layer can take the information to display.- pipeline:
The
Pipelineassociated with the layer.- interactive:
Indicates whether the rendering happens in an interactive viewport of OVITO Pro or to generate an output image. This lets your layer skip expensive computations in the interactive viewports.
- frame:
The animation frame being rendered.
As always, the parameter list should end with **kwargs. The class attributes font_size and text_color define
parameters, which OVITO Pro displays in the panel of the layer.
Drawing
The Canvas provides the following drawing functions. Positions and sizes are specified in relative
coordinates, ranging from 0 to 1 across the width and height of the viewport, with (0,0) being the lower left corner:
draw_text()draws a text string, andtext_bounds()computes the size of a text string.draw_image()draws a Qt image.qt_painter()provides a QtQPainterfor drawing arbitrary vector graphics.mpl_figure()provides a Matplotlib figure for drawing plots.
To align graphics with objects in the three-dimensional scene, the canvas can project a point from 3d space onto the 2d canvas using
project_location(), or convert a length in 3d space to its size on the canvas using
project_length():
class MarkOriginOverlay(ViewportOverlayInterface):

    def render(self, canvas: ViewportOverlayInterface.Canvas, **kwargs):
        # Project the 3d point (0,0,0) onto the 2d canvas:
        xy = canvas.project_location((0.0, 0.0, 0.0))
        if xy is not None:   # Point may be outside the visible area
            canvas.draw_text("Origin", pos=xy, anchor="center", font_size=0.05)
Using a viewport layer
- In OVITO Pro OVITO Pro
Add a Python script layer to a viewport and enter your class in the code editor, or install the layer as an extension package, which makes it appear in the list of available layer types.
- In a Python script Python scripts
Wrap an instance of your class in a
PythonViewportOverlayand add it to theoverlayslist of a viewport. The pipeline argument specifies the pipeline whose data gets passed to therender()method:from ovito.io import import_file from ovito.vis import Viewport, PythonViewportOverlay pipeline = import_file("input/simulation.dump") pipeline.add_to_scene() viewport = Viewport(type=Viewport.Type.Perspective, camera_dir=(-1, -1.5, -0.8)) viewport.zoom_all() viewport.overlays.append(PythonViewportOverlay(delegate=ParticleCountOverlay(), pipeline=pipeline)) viewport.render_image(filename="output/overlay.png", size=(600, 400))
The image on the right shows the result, including the second layer defined above.
See also
User-defined viewport layers: A scale bar, a data plot, and a highlighted particle