Histogram
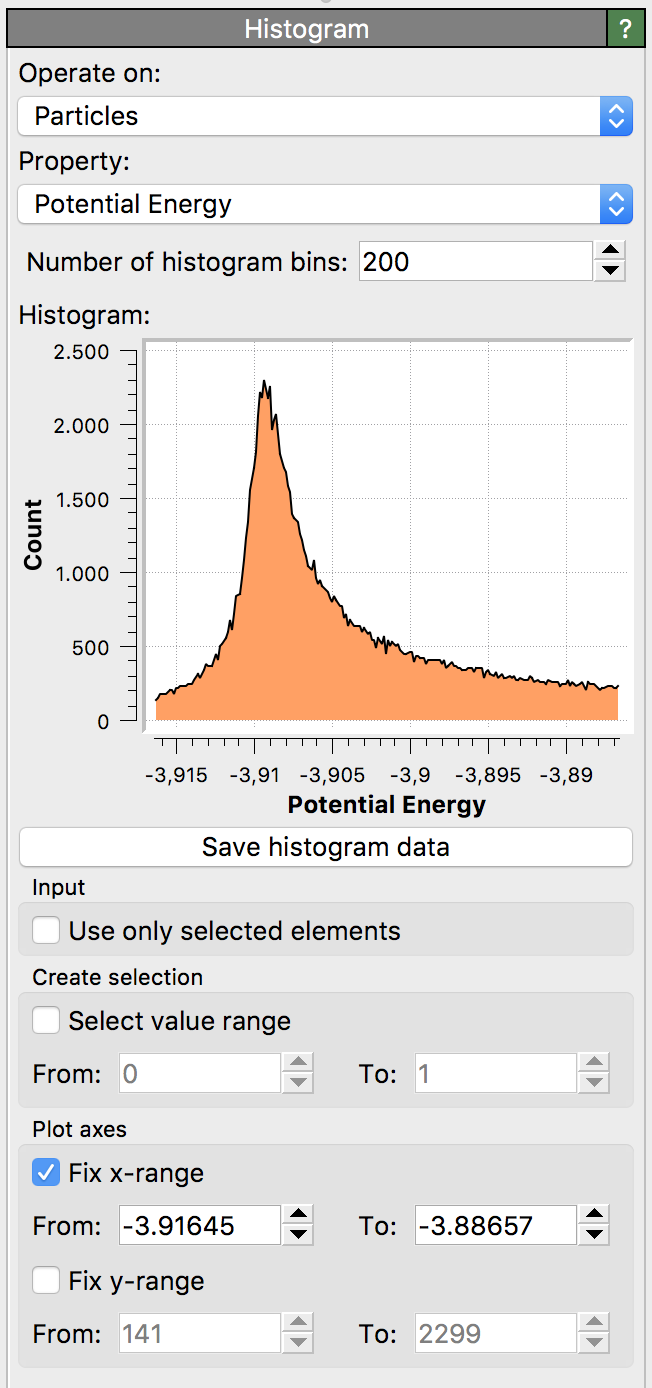
This modifier computes a histogram of the values of a certain property, taken over all particles, bonds, or other data elements in the dataset. Furthermore, the modifier lets you select all data elements that fall within a specified value interval.
Parameters
- Operate on
Selects the class of data elements the modifier should operate on (e.g., particles, bonds, etc.). The drop-down list will only let you select classes that are present in the modifier’s input data.
- Property
The source property for the histogram. Data elements whose property value is not a finite number (NaN or ±infinity) are excluded from the histogram and are never selected by the Select value range option. The number of such elements is reported by the
Histogram.num_nonfiniteoutput attribute (see below).- Number of histogram bins
Controls the resolution of the computed histogram. This parameter specifies the number of bins into which the value range of the property is divided.
- Normalization mode
Selects the normalization mode for the histogram. The default is to output absolute counts, i.e., the number of elements in each bin.
The second option is to normalize the bin counts to the total number of input elements (relative frequency). This is useful for comparing histograms with different numbers of input elements.
The third option is to normalize the bin counts to the total number of input elements and the bin width. This option is useful for comparing histograms with different bin widths. The generated histogram then represents a probability density function (PDF) of the property values, and the area under the histogram is equal to 1.
- Use only selected elements
Restricts the histogram calculation to the subset of particles, bonds, or other elements that are currently selected.
- Select value range
This option lets the modifier perform a selection of all data elements whose property values fall into the specified range.
- Plot axes
These modifier parameters control the histogram plot shown in the panel and let you zoom into a sub-region.
Outputs
The modifier outputs the histogram as a data table and some summary information as global attributes:
Output |
Description |
|---|---|
|
The computed histogram. Each row corresponds to one bin. |
|
The number of data elements selected by the Select value range option. Only present if that option is enabled. |
|
The number of data elements that were ignored because their property value is not a finite number (NaN or ±infinity). |
Time-averaged histogram
Note that the Histogram modifier calculates the histogram for the current simulation frame only and outputs it as a data table that may vary with simulation time. Subsequently, you can use the Time averaging modifier of OVITO to reduce all per-frame histograms to one mean histogram, which represents the average over all frames of the simulation trajectory.
See also
ovito.modifiers.HistogramModifier (Python API)